Back Up and Restore VMs with Azure Backup
Description
Azure Backup is a service for backing up your data in Azure. You can back up Linux and Windows VMs running in Azure with Azure Backup as well as on-premises servers. Azure Backup can be used for more than just backing up machines but this lab focuses on VM backups.
You will use Azure Backup to backup a Windows Server VM running IIS in this lab. You will configure a backup schedule and retention periods using a backup policy. You will finish by restoring the VM back to an earlier state by performing a restore operation. Along the way you will learn the key concepts of Azure Backup.
Learning Objectives
Upon completion of this lab you will be able to:
- Back up and restore virtual machines running in Azure
- Configure backup policies to schedule backups and define data retention periods
- Understand how snapshots are created using an Azure Backup VM extension
- Evaluate the different options available for restoring including in-place instant restores, restore to disks, and restore to new VMs
- Describe the default consistency level for Windows and Linux VMs in Azure Backup
Intended Audience
This lab is intended for:
- Azure administrators
- AZ-103 exam candidates
- Anyone responsible for backup and retention of virtual machines
Prerequisites
You should be familiar with:
- Azure VM and Storage Account basics
Introduction
Recovery Services vaults are the core service for backing up and restoring several sources of data. These include Azure VMs (Windows and Linux), on-prem machines, Individual files, Azure Files file shares, and Azure SQL Databases. Having all your data backed up in a central location makes it easy to manage and organize. Recovery Services vaults also enable disaster recovery scenarios by replicating data to vaults in other Azure regions and storage used for the vault is geo-redundant by default. The cost of the service is based on the number of instances you back up/protect and the amount of storage used. You will use a Recovery Services vault to back up a Windows Azure VM in this Lab.
You will create a Recovery Services vault using the Azure Portal in this Lab Step.
Instructions
1. In the Azure Portal upper search bar, enter recovery services, and click Recovery Services vaults in the results drop-down under Services:

2. Click +Add to create a new Recovery Services vault:

3. In the Create Recovery Services vault blade, enter the following values leaving the default value for the rest:
- Project Details
- Resource group: Select the one available
- Instance Details
- Vault name: lab-vault-#### where you replace #### with random digits to ensure a unique name within the Azure subscription
- Region: East US

4. Click Review + create.
5. Click Create:

6. Click Go to resource in the success notification that appears to navigate to the Recovery Services vault:

Take a moment to browse around the Recovery Services vault blade to see what you can do with it. You will be given specific instructions for what you need to do with your vault later in the lab.
Summary
In this lab step, you created an Azure Site Recovery vault that can be used to backup and restore data as well as replicate data across regions.
Connecting to the Virtual Machine (RDP)
Introduction
Remote Desktop Protocol (RDP) is a protocol developed by Microsoft that enables a remote connection to a Windows host. Remote Desktop uses a client/server model, whereby the initiating computer runs Remote Desktop client software to connect to the remote computer, which must run Remote Desktop server software. Remote Desktop server software is built into the Windows operating system. Windows also ships with a Remote Desktop client. Many free Remote Desktop clients exist for Linux and macOS, including those from Microsoft and Apple. The following instructions will detail how to connect using both:
- Remote Desktop on Microsoft Windows - installed by default.
- Remote Desktop for macOS - official Microsoft version available in the App Store.
Instructions will be similar for other Remote Desktop clients with different operating systems. Once your VM is in a running state, you can connect to it using a Remote Desktop client.
Instructions
1. Click the Azure Portal accordion menu ![]() in the upper-left corner followed by Virtual machines:
in the upper-left corner followed by Virtual machines:
![]()
2. Select the running ca-lab-vm VM from the list:

Note: If the VM is not listed, wait a minute and refresh the page.
3. From the Overview blade, click on the Connect > RDP command:

Note: The Overview blade displays helpful graphical information for your VM: CPU usage, disk input/output, and network traffic. Scroll up and down to view this information.
4. In the Connect to virtual machine blade that appears, click Download RDP File:

This generates and downloads a Remote Desktop file (.rdp extension) that serves as a shortcut to connect to your machine. The .rdp file is used by the Remote Desktop client to connect to the running VM.
Note: You may run into a permissions error when attempting to access the RDP file. This just means that your provisioning resources for this Lab, including the permissions that manage your user, aren't done deploying. Refresh the page every minute or so until you're able to continue.
The following instructions are divided based upon your operating system, either Windows or macOS.
Instructions for Windows
5.a. Open the downloaded .rdp file to connect to your VM.
You will see the following warning:
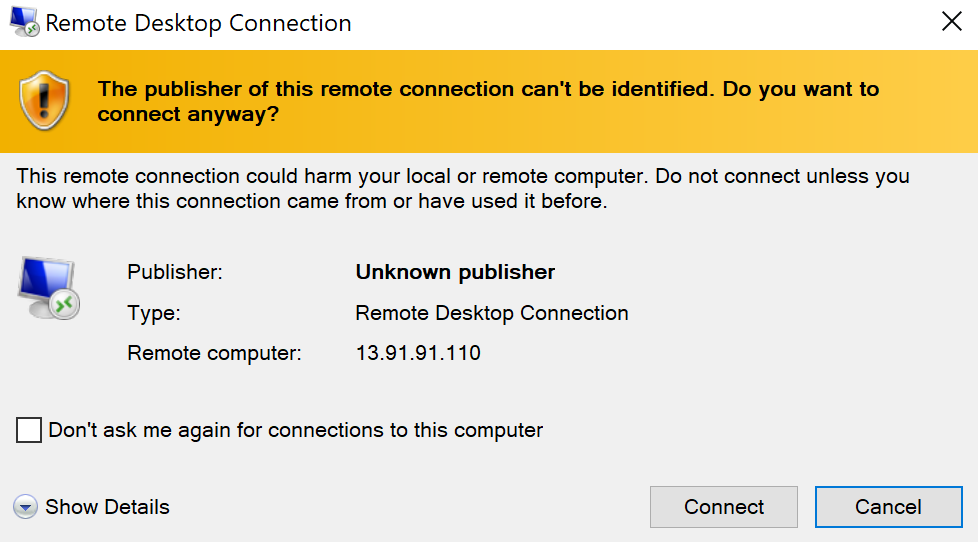
5.b. Click Connect.
You know where the .rdp file came from, so you can ignore the warning.
5.c. Enter the credentials for the VM:
- User name: student
- Password: 1Cloud_Academy_Labs!
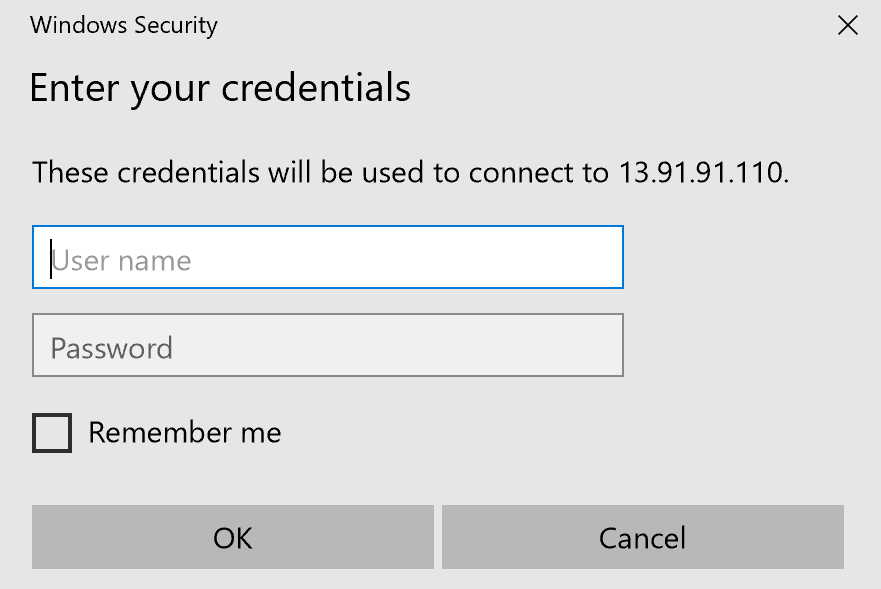
![]() Warning: If you receive a connection error instead of the credentials prompt, wait a minute and try again until the VM is ready to accept the connection. Additionally, if Mircosoft detects another account you may have to click more choices > use another account.
Warning: If you receive a connection error instead of the credentials prompt, wait a minute and try again until the VM is ready to accept the connection. Additionally, if Mircosoft detects another account you may have to click more choices > use another account.
5.d. Click Ok.
You will be prompted with a warning about the certificate not being from a trusted certifying authority:

5.e. Click Yes to bypass the warning.
This warning is expected and you can safely ignore it.
5.f. Proceed to instruction 6.
Instructions for macOS
5.a. Open the downloaded .rdp file to connect to your VM.
You will see Negotiating Credentials…
![]() Warning: If you receive a connection error, wait a minute and try again until the VM is ready to accept the connection.
Warning: If you receive a connection error, wait a minute and try again until the VM is ready to accept the connection.
5.b. When presented with the Verify Certificate dialog, click Continue:
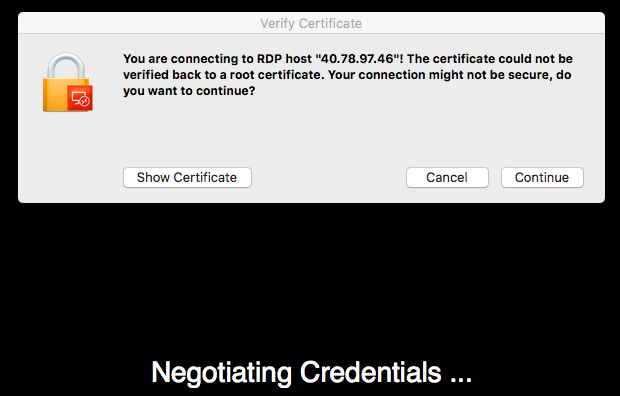
Although the certificate cannot be verified, it is safe to continue.
5.c. Enter the login credentials configured for the VM:
- User name: student
- Password: 1Cloud_Academy_Labs!
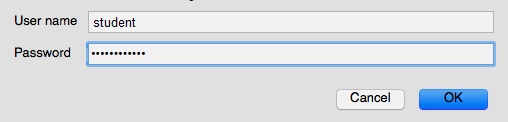
5.d. Click OK when ready. You will see "Connecting RDP..."
The following instructions are for all operating systems
6. Observe several Windows startup notifications in the Remote Desktop window.
After a few minutes, you will be able to interact with the Windows VM.
Important! The CPU and memory specifications for the VM in this lab are modest. For example, only two CPU cores. Therefore, connecting via RDP, which triggers several Windows initialization processes, causes an unresponsive user interface. In some instances, your screen may go black for 20 seconds, then transition to blue as the "Please wait for the Local Session Manager" Windows message is displayed. The entire Windows startup process typically takes a couple of minutes. After Windows is up and running, it is like any other Windows host. It is just a Windows host running in Azure.
Tip: See Troubleshoot Remote Desktop connections to a Windows-based Azure Virtual Machine if you experience lasting problems connecting to the VM.
7. Click No on the blue Network message that displays on the right side of the screen and close Server Manager by clicking the x in the top right corner of the window.
You will see the Windows Desktop:
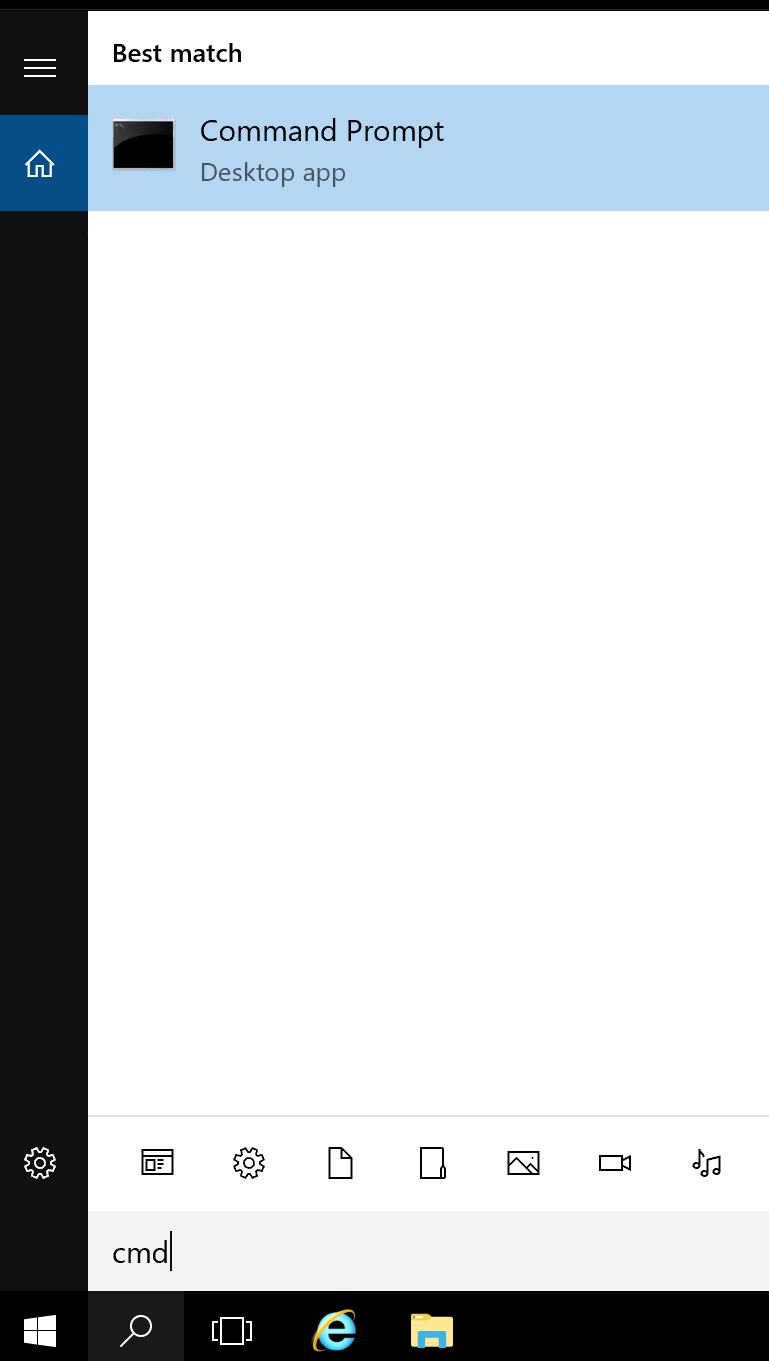
8. Click on the search icon near the bottom left corner and enter cmd. Press enter to open a command prompt.
9. Enter the following command to view system information related to the virtual machine's operating system:
Copy codesysteminfo | findstr.exe OS
The OS Name is Microsoft Windows Server.
10. Close the command prompt window by clicking the x in the upper-right corner.
Summary
In this Lab Step, you used a Remote Desktop client to connect to an Azure VM running Windows.
Installing IIS on the Lab VM with PowerShell
Introduction
For this lab, you will use Microsoft Internet Information Services (IIS) as the application that you will customize to show the effects of backing up and restoring data. IIS is a web server that will allow you to easily verify the effects of the data changes using your web browser. You will install IIS on the Windows Server lab VM that is created by the Cloud Academy Lab environment using PowerShell in this lab step.
Instructions
1. Click the magnifying glass in the lower-left corner and enter powershell.
2. Click on Windows PowerShell:

3. Enter the following at the PowerShell prompt to install a basic IIS web server:
Copy codeAdd-WindowsFeature Web-Common-Http
A progress bar is displayed until the installation is complete and the PowerShell prompt is returned to you:

You will confirm that the IIS webserver is up and running by using your web browser to navigate to the VM.
4. From the lab VM's Overview blade, copy the Public IP address of the VM:

The Network Security Group attached to the VM allows HTTP traffic so you can reach the VM's webserver with your browser using this IP address.
5. Open a new browser tab and navigate to the VM's public IP address:

This confirms you have installed IIS and it is working as expected.
Summary
In this lab step, you used PowerShell to install the IIS web server.
Backing Up the Lab VM with Azure Backup
Introduction
Azure Backup is a service for backing up data in Azure. The data is stored in a Recovery Services vault. You can back up Linux and Windows VMs running in Azure with Azure Backup as well as on-prem servers. Windows VM backups are application-consistent meaning that VM files, as well as memory and pending I/O operations, are included in the backup snapshot. Linux VM backups are file-consistent by default but with custom scripting, it is possible to create application-consistent backups for Linux. For a full treatment of the capabilities of Azure Backup, refer to the documentation.
You will use Azure Backup to backup the entire VM running IIS. You can create multiple backups for a VM and each backup is called a restore point. You have the ability to create restore points manually or via a schedule defined in a backup policy. You will see each method works in this lab step.
Instructions
1. From the ca-lab-vm blade in Azure Portal, click Backup in the left panel:

You can also configure VM backups from the Recovery Services vault blade in the Portal. It is particularly useful to use the vault blade when backing up more than one VM. However, for individual VMs it is convenient to manage the backup from the VM blade.
The Recovery Services vault you created earlier is automatically selected for storing the backup. A default backup policy (DefaultPolicy) is created when you created the vault, but you will configure your own next.
2. Click Create (or edit) a new policy.
3. In the Backup policy blade, enter LabBackupPolicy as the Policy name and configure the Backup schedule and retention fields freely (it will not impact the lab):

The backup policy defines when restore points are created as well as how long they are retained for. In practice, you can consider your organization's recovery point objective (RPO) and retention requirements to appropriately configure the backup policy. Daily backup restore points can be retained up to 9999 days (27 years) while weekly, monthly, and yearly ones can be retained for 99 years.
There are also Instant Restore points that can be retained for up to 5 days. Instant restore points allow you to perform in-place restores without the need to create a new VM or new disks. Instant restore points are stored outside of the vault for rapid recovery.
4. Click OK to create the backup policy.
5. Click Enable backup to start protecting the VM with Azure Backup.
After a minute the backup is enabled.
6. Return to the Backup blade and observe the view summarizing the backup state of the VM:

This will create the backup policy and start protecting the VM. A VM snapshot extension is automatically installed on the VM. However, the initial restore point will not be created until the time you specified in the backup policy schedule. You will manually create the first restore point next instead of waiting for the scheduled one.
7. Click Backup now in the command bar to kick off the initial backup.
8. In the Backup now blade, leave the default Retain Backup Till value and click OK.
After a few seconds a notification appears:

This tells you a backup job has started. It takes more time for the backup job to complete. You will monitor the job next.
9. Click View all Jobs to view the backup job operation table.
There will be a Completed job for configuring the backup and one In progress while the initial backup takes place:

The first backup has to backup the entire file system. Following backups are generally much faster because the restore point only needs to store the changes from the previous restore point.
10. Click Backup to view details about the operation.
Focus on the Sub Tasks:

The Backup operation consists of taking a snapshot and transferring the snapshot data to the vault. The snapshot usually completes in under ten minutes while transferring to the vault can take up to 24 hours for the initial backup. However, you can use the snapshot to perform an instant restore even before the data is transferred to the vault.
11. Return to the ca-lab-vm Backup blade and observe the changes to the summary:

There is now an Application Consistent Snapshot restore point available to restore the VM to.
Note: If you don't yet see the Snapshot periodically refresh the view until the snapshot operation completes
Summary
In this lab step, you created a backup policy that configures the backup schedule and retention periods for Azure Backup. You manually initiated the initial backup. The initial backup operation can take several hours to complete, but you can perform instant restores with the snapshot data before it is stored in the vault.
Performing a Restore Operation on Lab VM with Azure Backup
Introduction
You can use Azure Backup restore points to completely restore VMs to the point in time of the snapshot or you can create disks from the restore point that you can use to retrieve files if that is all that is required. For use cases requiring only individual file backups you should consider installing the Azure Backup Microsoft Azure Recovery Services (MARS) agent on the VM. The MARS agent is built for individual file and folder recovery scenarios.
You will perform a complete restore of the VM in this Lab Step. You will perform an in-place instant restore which does not require creating a new VM nor new disks. The original disk data is overwritten in-place. This type of restore is said to be "instant" because it uses snapshots that are already outside of the Recovery Services vault so there is no need to wait for the data to be transferred out of the vault to a staging location. There is some delay involved while the VM disks are overwritten and the VM must be stopped to begin the restore operation.
Instructions
1. In your RDP session's PowerShell terminal, enter the following to customize the web page being served by IIS:
Copy codeAdd-Content -Path C:\inetpub\wwwroot\Default.htm -Value $($env:computername)
You will essentially rollback this change by restoring the VM to an early point in time. In this illustrative example, only a single file is changed so a VM restore may be overkill. However, you would follow the same steps for more complex installations involving more than single-file changes.
2. Refresh the browser tab that navigated to the IIS website and confirm the default web page has changed to a new one that displays the VM name:

3. In the Portal, click Overview in the left navigation panel of the VM blade:

4. Click Stop followed by OK to stop the VM:

To restore the disks with the snapshots the VM must be stopped and deallocated. After a minute or two, the confirmation notification appears:

5. Click Backup in the left navigation panel.
6. Click Restore VM to kick off a restore operation:
![]()
7. In the Select Restore point blade, select the only available Snapshot and click OK.
8. In the Restore configuration blade, click Replace existing to perform an in-place restore and choose the only available storage account as the Staging Location:

The staging location is where disks are created from the snapshots before they replace the VMs current disks. The Create new configuration can create an entirely new VM or new disks from the restore point rather than an in-place restore.
9. Click OK followed by Restore
10. Click View all Jobs.
11. Click the Restore operation to view its details.

The restore operation should complete in ten minutes or less. The Transfer data from vault operation is completed "instantly" because you used an in-place restore using a snapshot already stored outside the vault. Once you see the following it is OK to proceed to the following instructions:

12. Return to the Overview blade and click Start to start the VM:
![]()
You will now confirm the VM has been restored to the point before you changed the web page served by IIS.
13. After waiting 30 seconds, click Refresh to reveal the new public IP address assigned to the VM:
![]()
14. Copy the Public IP address:

15. Navigate to the IP address in a new browser tab:

This confirms the VM has been restored to the early restore point!
Summary
In this lab step, you performed an Azure Backup restore operation. Specifically, you performed an in-place instant restore which can be completed more quickly than other restore operations because there is no delay for transferring data out of the vault to a staging location.


